
Tips for analyzing your data:
"What happened to my bird?"
We are asked this question a lot, and while we are certainly not experts on all species, we have looked at a lot of data over the years. Here are a few basic steps we follow when analyzing datasets that you can try:
 Graph the data
|
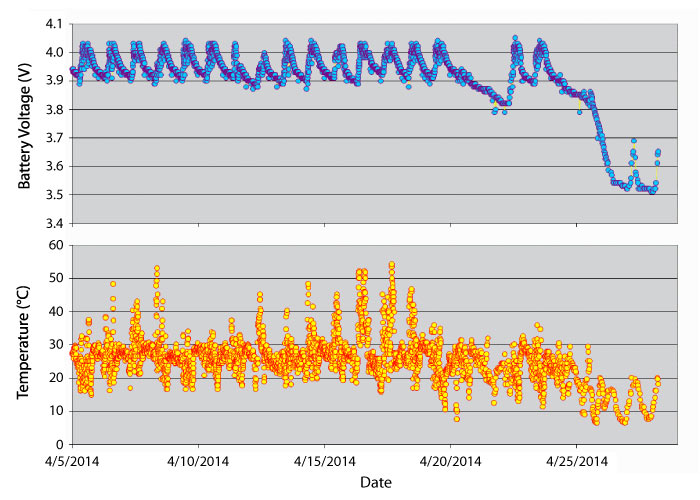
| Example: The graph above contains sample data that shows a period of "normal" temperature and battery voltage fluctuations, followed by a marked drop in battery voltage and temperature. Such a decline may be indicative of bird mortality or transmitter detachment, particularly if there is a concurrent lack of activity, as shown in the graph below. |
|
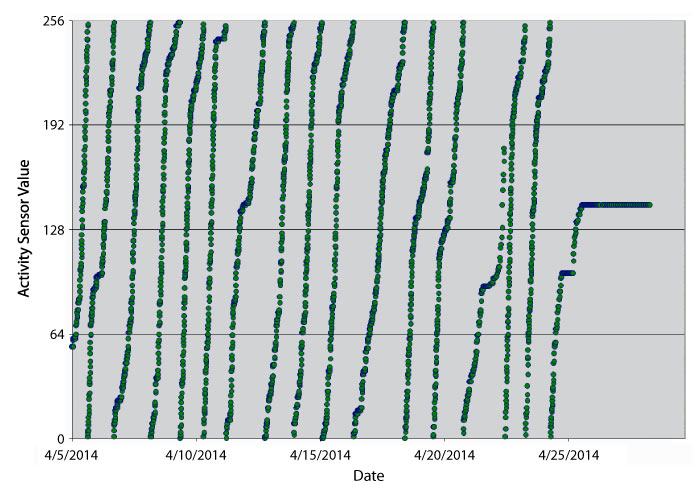
| The plot of activity sensor data from one of our GPS/GSM transmitters clearly shows a change in behavior before messages stopped being received. |
Plot latitude and longitude through time
|
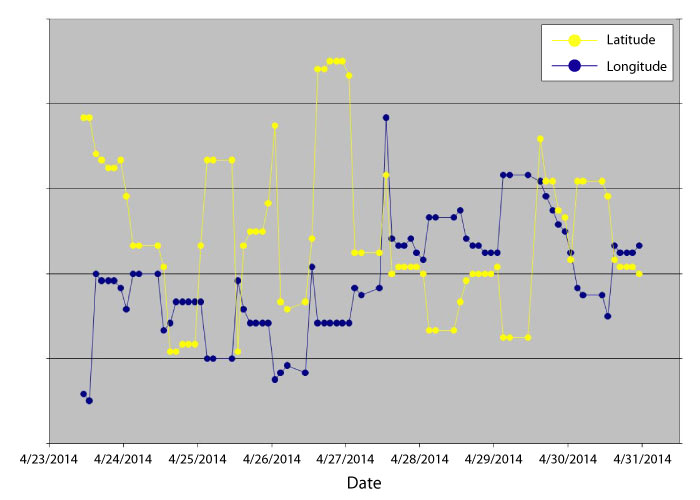
| Example: A customer was concerned that one of his GPS transmitters might be down (due to bird mortality or transmitter detachment) as the temperature and battery voltage had dropped for several days. A quick look at a graph of latitude and longitude data showed us that the locations were changing by distances greater than the margin of error for GPS; from this we could conclude the animal was still active. |
Look at your entire dataset
When looking at Argos/GPS data, keep in mind that the time a transmission is made during a satellite pass ("message time") is not necessarily the same as the time when the GPS fixes were taken ("location time"). Argos/GPS PTTs take location fixes at programmed hours, then transmit those data to the Argos system at a later time. Be careful to distinguish between the two when analyzing your data.
Data and Transmission Questions
There are many potential causes for discontinued communication from a transmitter. The most likely reason for a solar-powered transmitter to stop transmitting is that it is not receiving enough sunlight to sufficiently charge the battery. This can occur due to feather coverage, poor weather, or habitation of a bird in an area with limited sun exposure. Once the transmitter receives enough sunlight and the battery has recharged, a transmitter will resume transmission.
GPS/GSM 20-70 Transmitters must be within range of the cellular network in order to send data. When birds stay out of range of the GSM network, data will not be transmitted, but will still be archived (up to 258,000 GPS fixes). Upon future connections with the GSM network, the archived data will be sent, starting with the most recent. Unfortunately, if a bird dies out of range of the GSM network, any unsent data cannot be transmitted. GSM transmitters that are recovered can be returned to us for extraction of the complete archived dataset.
Other possible reasons for discontinued transmissions include:
There are no obvious characteristics in a dataset to distinguish between a dead bird and a detached transmitter. Both often result in a drop in temperature and activity, and can sometimes lead to discontinued transmission. Detachment may occur due to improper harnessing, rough treatment of the device by the bird, or human interference. Many users have been able to recover downed birds and transmitters by using the most recent location messages or our Ground Track (GT™) feature.
Before GPS/GSM 20-70 Transmitters send data, they first transmit an identification message to a nearby cell tower to establish a connection with the GSM network. Once the connection is made, the transmitter will send any data it has archived to be uploaded to the GSM servers, and the servers pass on that data to the user via email. Throughout the day, the servers scan the incoming datasets for changes and send a new email each time any are detected. However, if a transmitter attempts to establish a connection with the GSM network, but the connection is not strong enough for it to transmit data, the servers will still send an email of the existing data to the user. Receiving several of these identical emails is often an indication that the bird is in an area of poor reception.
Large datasets are more likely to have statistical outliers. Outliers can result from transmission interference, transmitter damage, or an occasional erroneous sensor reading. To help reduce data error, our engineers have programmed our GPS-equipped avian transmitters and satellite fish tags with a CRC checksum to detect most incorrect data messages and remove them for a more reliable final dataset.
If statistically improbable outliers (such as an altitude reading above any reasonable height) are causing your data to become skewed, try removing any implausible data points beyond a reasonable threshold measurement and replotting the data.
Sometimes, looking at data in a different format can reveal patterns and provide clarity. Use the methods listed at the top of this page to reexamine your data and see if any answers emerge.
If you have tried these methods and are still uncertain, please send us your raw, unparsed Argos data (in PRV/A DS format) and we will look it over. Please send more than just the data that are causing you concern. By looking at a larger data sample, we can see the "typical" behavior of your study subject and use that to better understand any changes in the data over time.
PTTs with GPS capabilities take location fixes at specified hours and temporarily archive them. When they transmit those positions to the satellites, Argos uses the Doppler-shifted frequencies to determine each PTT's location at the time of transmission, the same way that it does for our PTTs without GPS. Ultimately, users receive two sets of location fixes: one set of GPS locations from the PTT and one set of Doppler locations determined by the Argos satellites. Although GPS locations are more precise, Argos Doppler locations can still be useful.
The amount of battery voltage necessary for a PTT to take a GPS fix exceeds the amount of power needed for it to transmit. If a PTT does not have sufficient battery voltage to take GPS fixes, users will still receive Doppler locations from the next time the PTT transmits.
The accuracy of the Argos Doppler locations can also suggest why there may be gaps in a dataset. Doppler location accuracy and the amount of messages received by Argos during a satellite pass are indicators of how well a PTT is being "heard" by the satellites. Data gaps that correspond with Doppler locations of a lower location class often mean that a PTT's transmissions are not successfully reaching the satellites or are corrupted when received.
Through years of experience and working with thousands of datasets, we have encountered two main causes of insufficient light records. The first is an animal's occupation of depths below the photic zone, where sunlight does not penetrate. The second is consumption of the pop-up tag by another animal. For more details regarding tag consumption and empirical analysis please see the following manuscript:
Was my science project eaten? A novel approach to validate consumption of marine biologging instruments
Emily R. Tolentino, Russell P. Howey, Lucy A. Howey, Lance K. B. Jordan, R. Dean Grubbs, Annabelle Brooks, Sean Williams, Edward J. Brooks and Oliver N. Shipley